Proteomics
Routine proteomic analyses
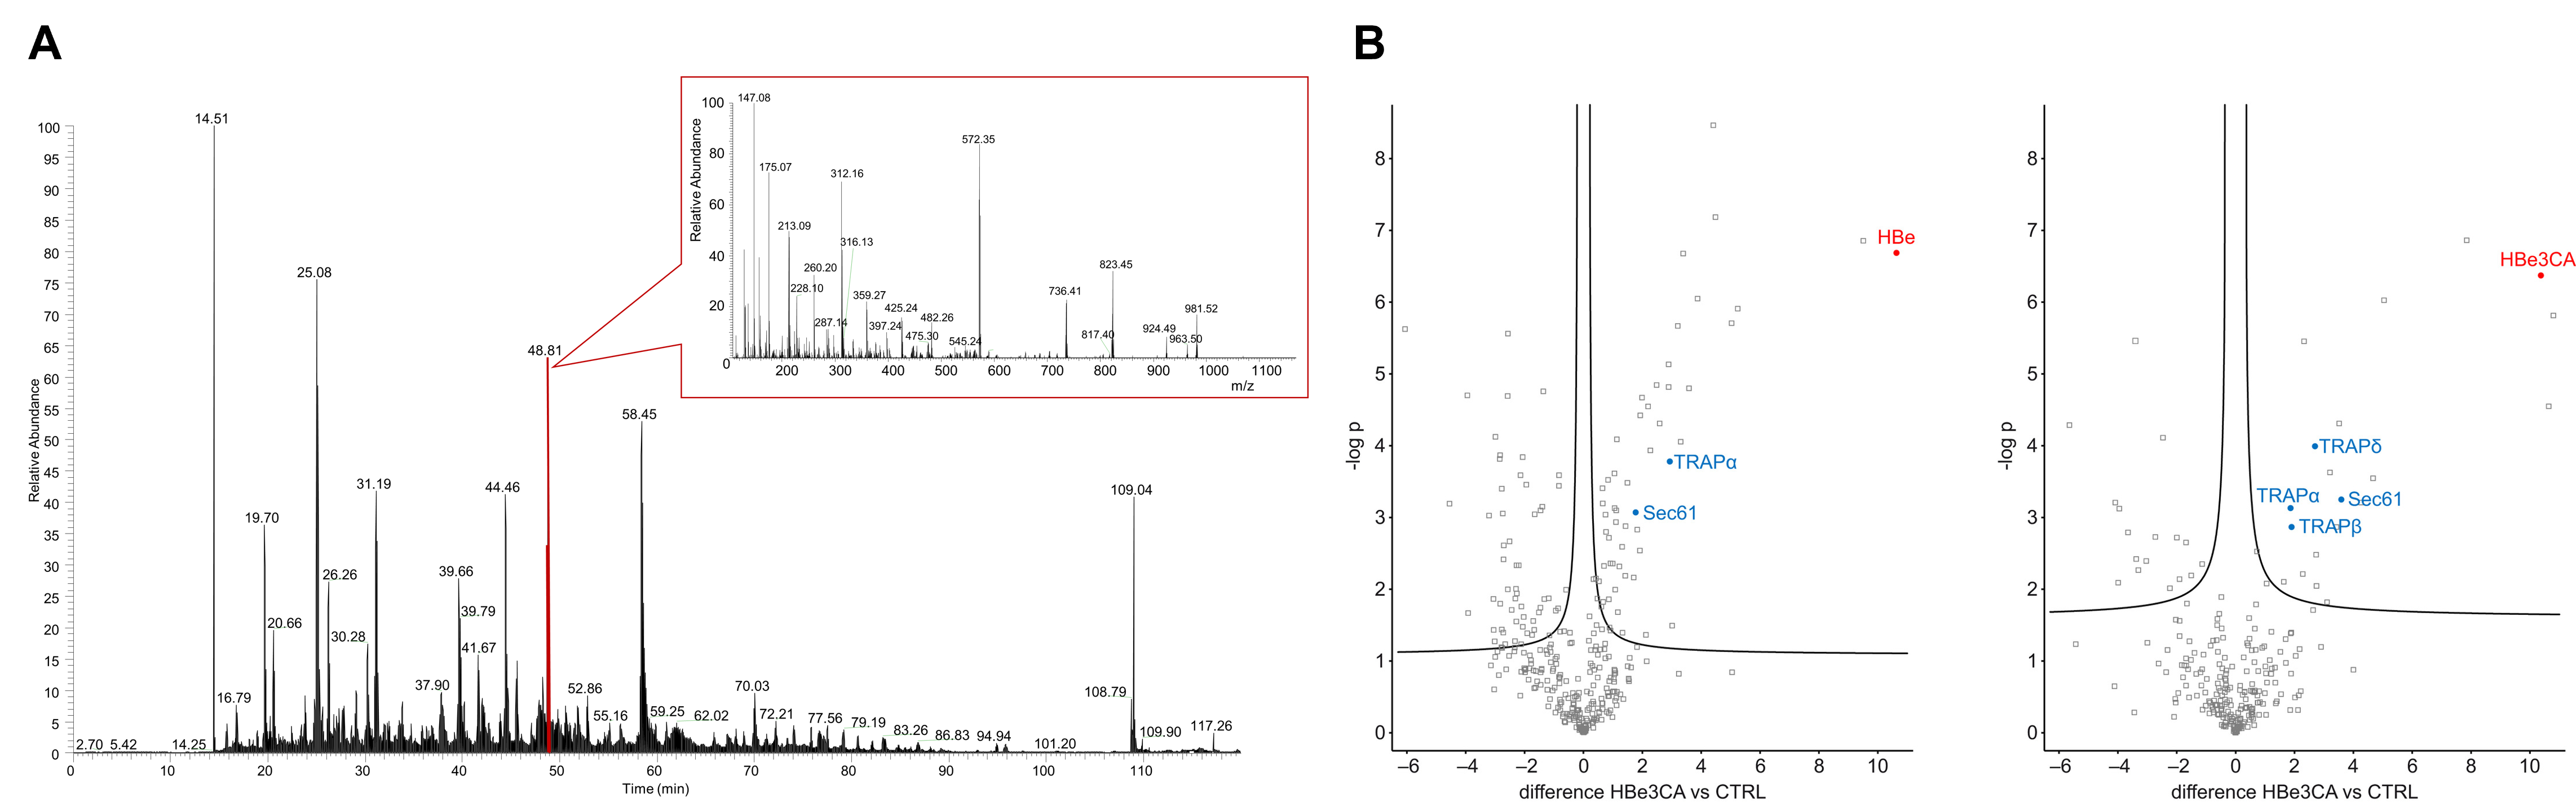
Our group is involved in numerous projects where the MS-based proteomic approaches is required. These projects deal with, for example, the research of Hepatitis B viral infection or analysis of rhomboid dependent proteome changes, etc.
We provide following proteomic analyses:
- Intact mass analysis
molecular weight determination of protein or oligonucleotides by MALDI-TOF or ESI-TOF
- Protein identification
including protein complexes characterization from gel or solution
- Characterization of posttranslational modifications
phosphorylation, acetylation, methylation etc.
- Protein quantification
relative quantification (label-free, SILAC labeling)
Proteomic research
In our research projects we focus on:
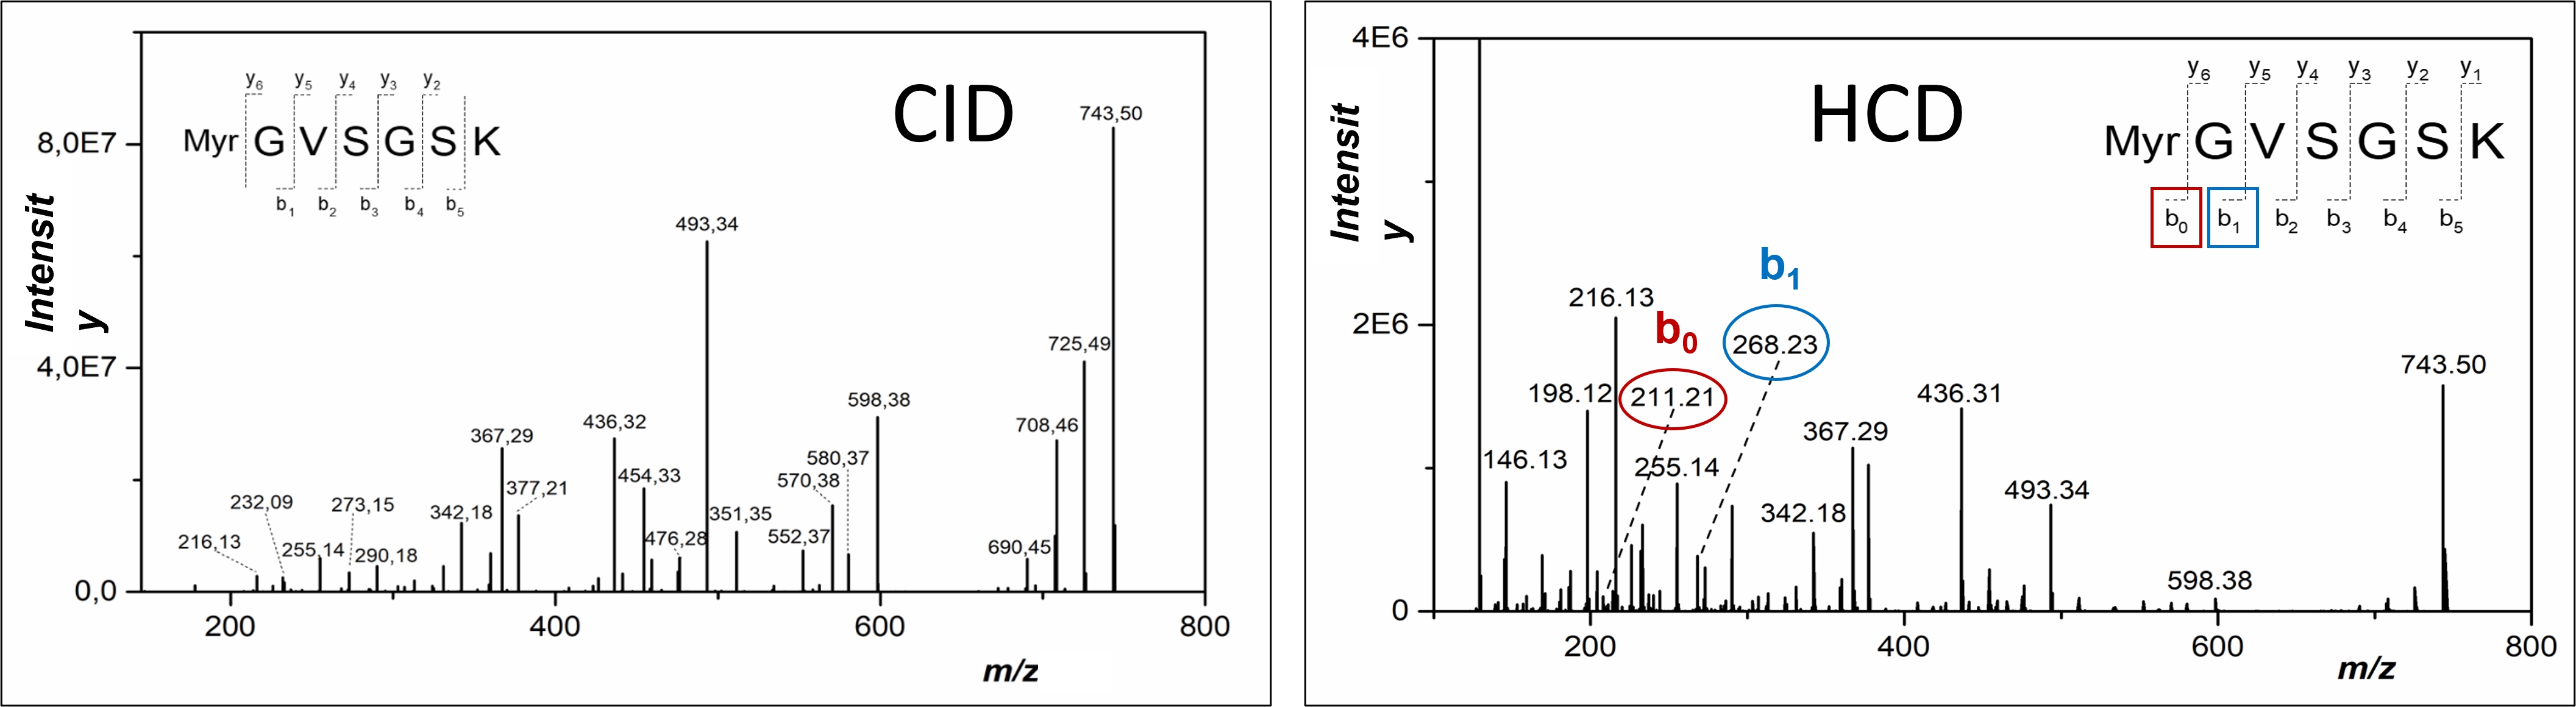
- analysis of lipoproteins/lipopeptides and membrane proteins
Separation and identification of lipoproteins/lipopeptides is rather challenging due to the limited solubility of lipo-modified segments in water-based solutions, whose are exclusively used within standard proteomic workflows. Therefore, we focus on the implementation of new workflows to the increase the yield of lipo-modified and hydrophobic segments of the proteins.
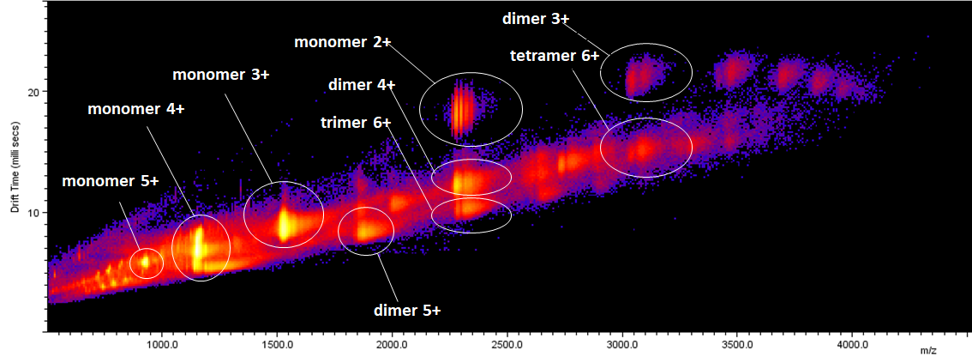
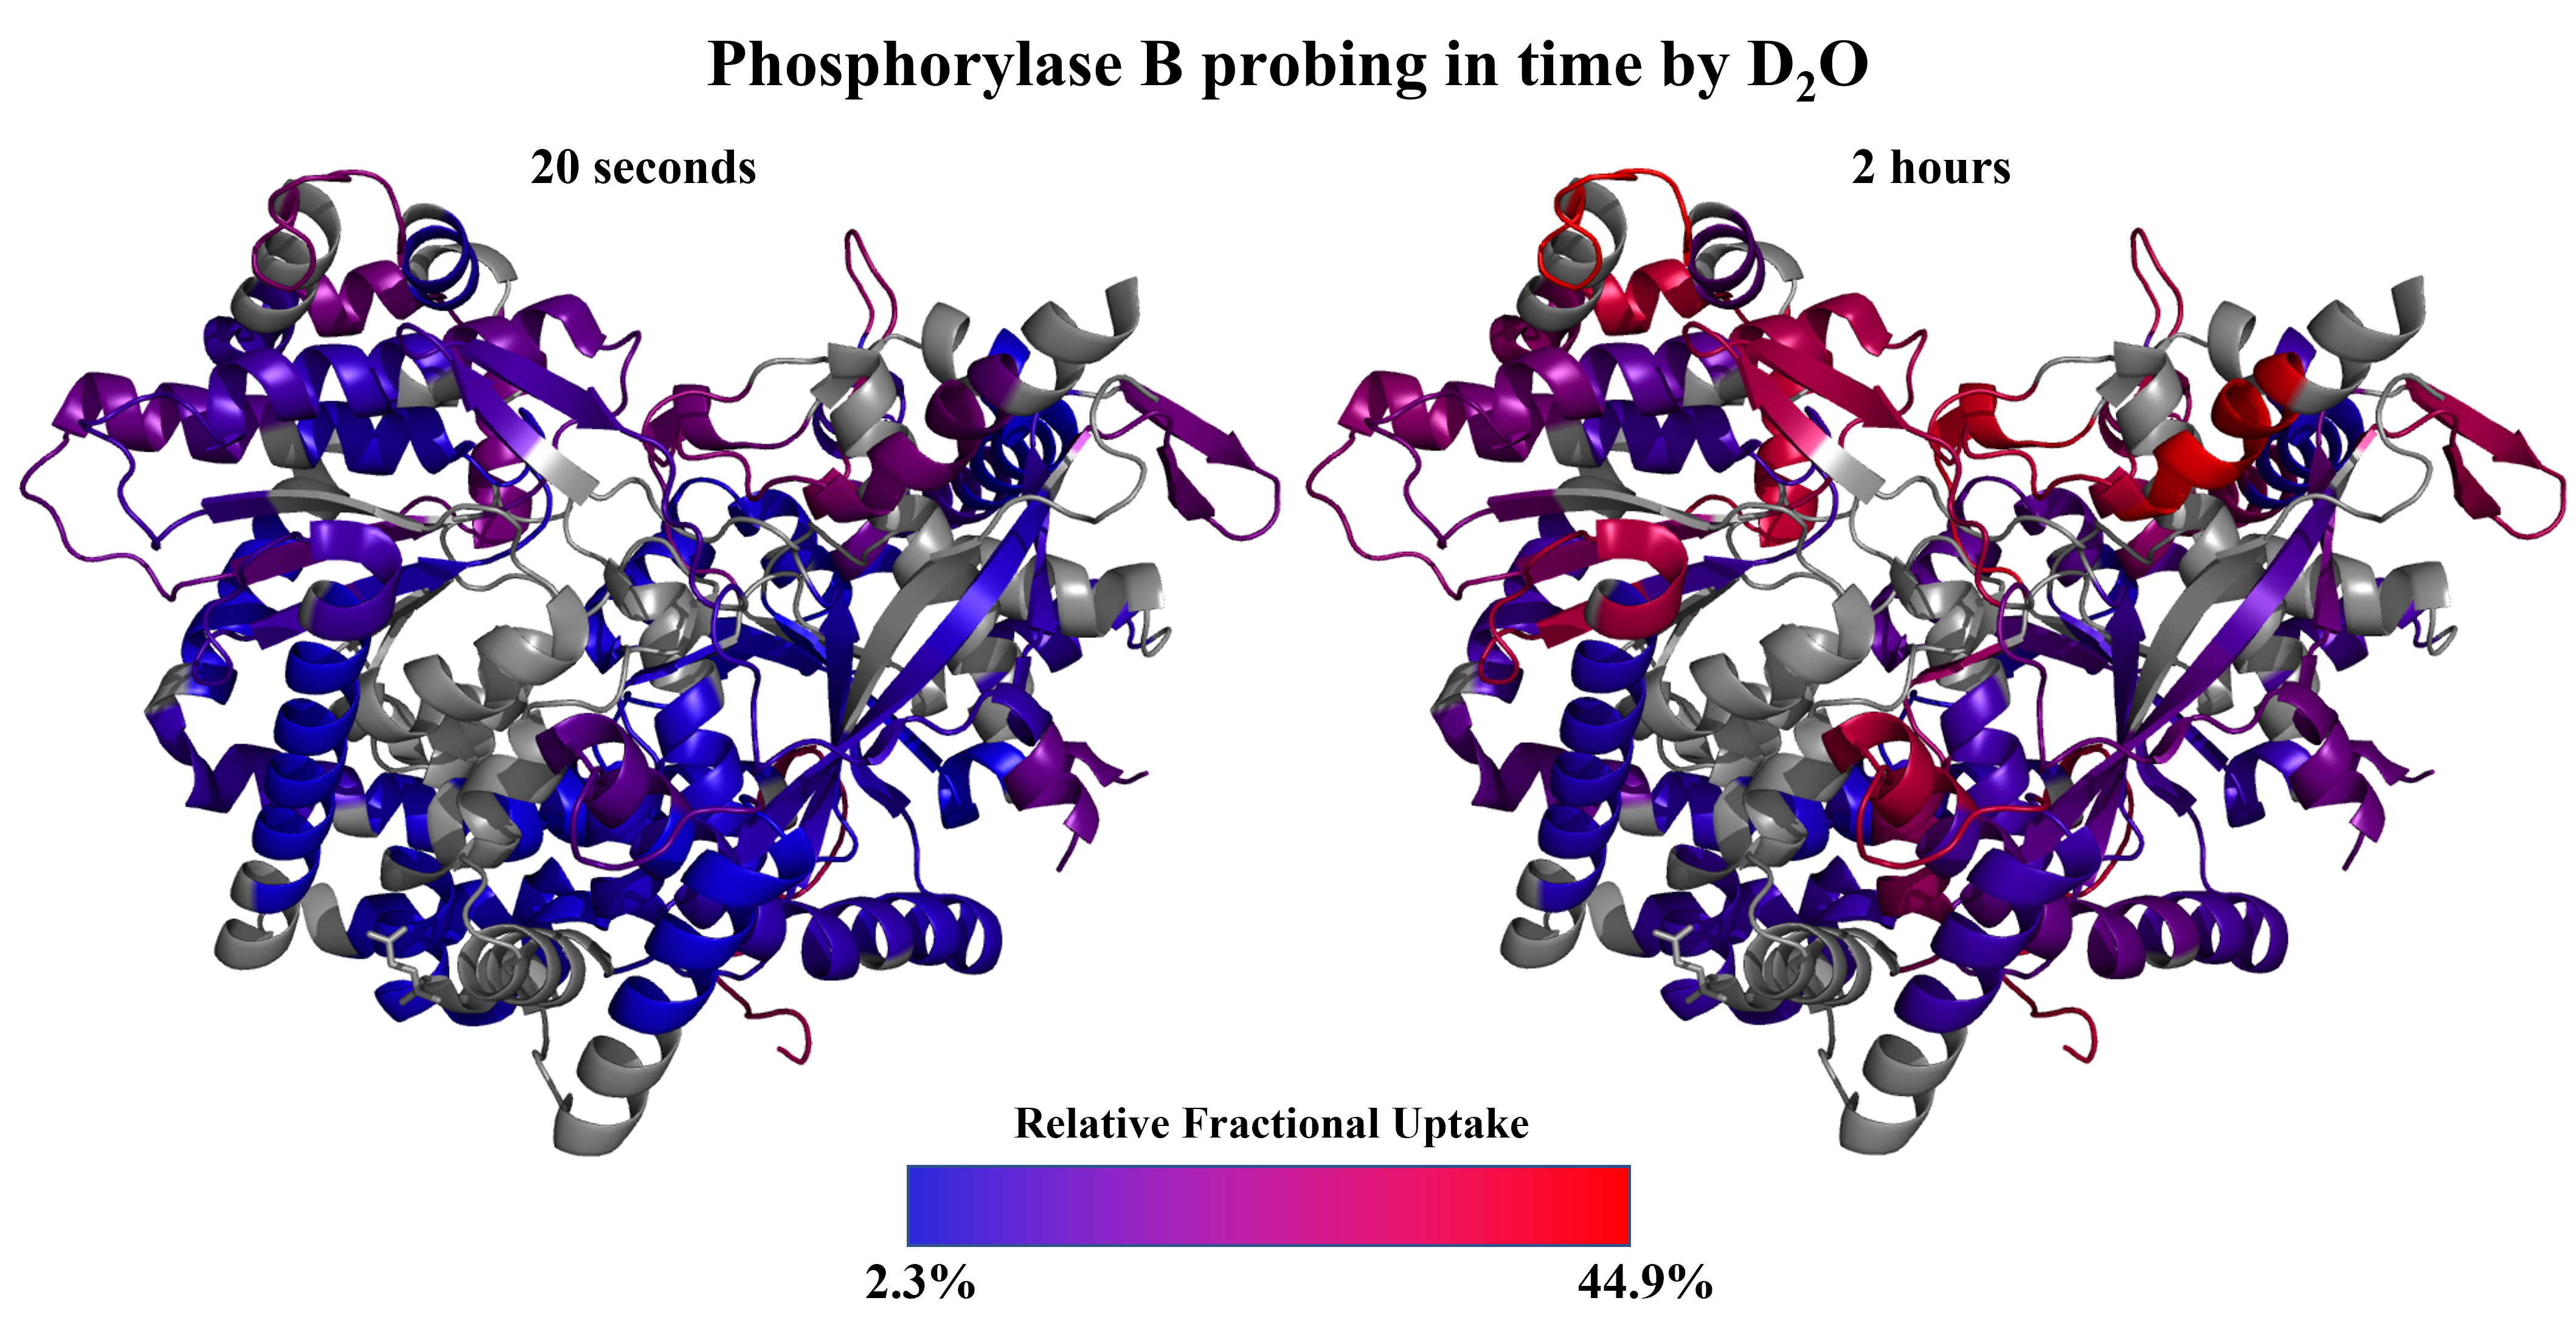
- implementation of novel structural proteomics approaches. In the field of structural proteomics, we implement the following methods:
native MS
protein covalent labelling
protein crosslinking
hydrogen-deuterium exchange MS
These complementary methods allow to study protein structures and characterize not only protein-protein interactions but also interactions of proteins with other biological molecules.